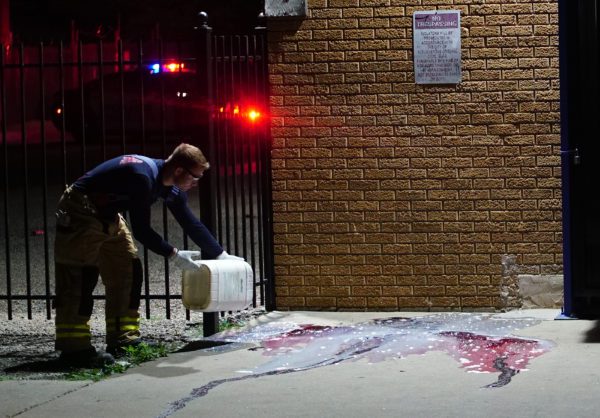
Albuquerque Fire Rescue personnel clean blood from the sidewalk following a homicide on the 100 block of Pennsylvania NE .Photographed on Sunday June 20, 2021. (Credit Image: © Adolphe Pierre-Louis / Journal / Albuquerque Journal via ZUMA Wire)
In 2020, the number of murders in most large American cities rose sharply. They continued to go up in January and into the spring. Now, as we reach the one-year anniversary of last year’s surge in violent crime, which began in early June, murder rates are beginning to level off. Some cities are even seeing decreases, but the figures for the year so far still beat last year’s.
| New York City | |||
|---|---|---|---|
| Month | 2020 | 2021 | Change |
| March | 25 | 34 | + 36% |
| April | 38 | 44 | + 15.8% |
| May | 37 | 37 | 0.0% |
| January through June | 192 | 213 | + 10.9% |
| Chicago | |||
|---|---|---|---|
| Month | 2020 | 2021 | Change |
| March | 28 | 42 | + 50% |
| April | 58 | 53 | – 8.6% |
| May | 85 | 64 | – 24.7% |
| January through June | 334 | 336 | + 0.6% |
Note: In 2019, the total number of homicides in Chicago between January and June was 252.
| Washington, D.C. | |||
|---|---|---|---|
| Month | 2020 | 2021 | Change |
| March* | 8 | 11 | + 37.5% |
| N/A | N/A | N/A | N/A |
| May** | 17 | 15 | – 11.7% |
| January through June | 79 | 93 | +17.7% |
*I rcompared the “year to date” totals of March 1, 2021 to the “year to date” totals of March 31, 2021.
**I compared the “year to date” totals of April 30, 2021 to the “year to date” totals of June 1, 2021.